Learning to Debug program is a very critical skill as you progress as a programmer. My initial days of debugging in python meant only to add a print statement and see output in console to observe what is happening in the code.
It will take multiple trial and error to identify the problem and make updates to the code.
I was so cringe about why the hell life is difficult compared to a .net developer with comfortable breakpoints stop and continue features when I started ten years ago just peeking into the desks of my colleague who worked in VB
Only then I became aware of the debugger pdb available in python.
A debugger first loads all statements and lines of code and points where to pause the code execution.
The user defined statements are converted into processor commands which are then converted to frames for execution.
When a debugger pauses the last frame with all the respective values from memory is loaded.
The user can modify and proceed to step through the program.
The high level code converted to machine language instructions can be viewed by using the below statements.
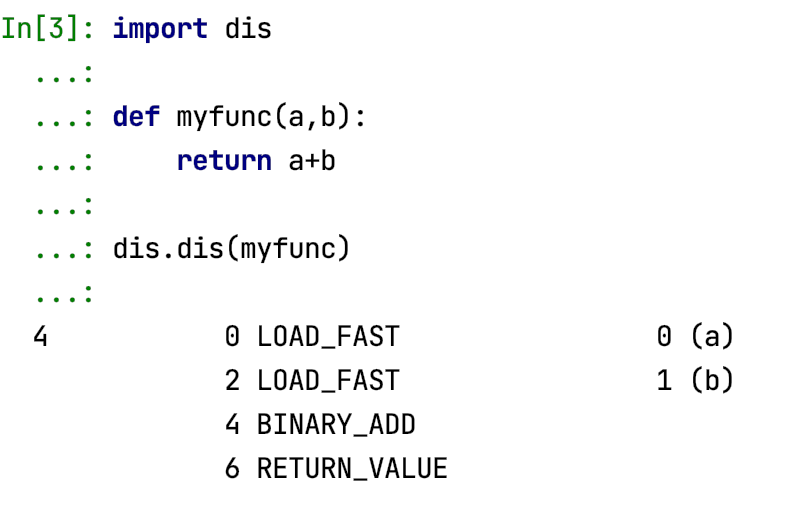
Alright, this is nice to see how the code is executed, beyond that we are not going to do anything. Just wanted to show you how the commands are getting converted to low level.
We have to start using the debugger to break, step through and continue the execution.
Debug using pdb
There are multiple ways to use debugger,
By updating the code if you use a simple text editor to code, or some cool intellisense alike features if you use Pycharm, Visual Studio, Eclipse or spyder like IDEs.
I will explain usage of a raw debugger without dependence on any IDE. I personally use Pycharm, but if you install it on a lower power machine the computer will slow down.
The core python debugger is provided by library pdb.
Lets understand this through an example.
There are 4 steps,
1.) The line before which you want the program to pause execution, you should add statement, pdb.set_trace()
When the set_tace() executes the program pauses and control will be available in command terminal. Using which all the variables, functions & class in the memory can be accessed. Or any valid python statement can be executed as well.
2.) To proceed to execute the next, one statement – press KEY ’n’. This is called step over action. If the statement under execution is a function call, then the result will be returned.
3.) To go into the calling function, KEY ’s’ should be used. Then from then on you shall either decide to step over or step in as per your analysis.
If you are sure what should be happening is a statement then you can attempt a step over. If it doesn’t happen so, then in the next try remember to step in for more analysis.
4.) To continue execution instead of stepping in or stepping over, you use the KEY ‘c’. This will make the execution to go further on its own unless another pdb.set_trace() command is encountered.
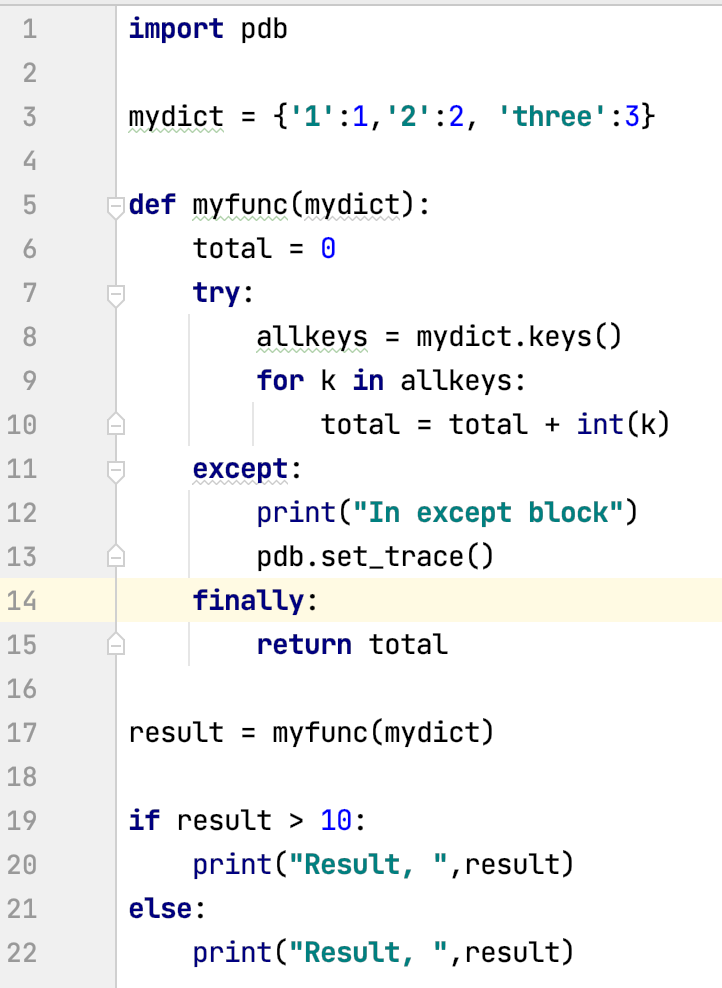
Execute the above program in your console and see how the breakpoint works, also try using the commands referred above.
Know the amount of memory consumed by python statements
Whenever a program keeps increasing its memory consumption as it runs, there is a high chance some of the objects are not cleaned, closed or released properly. And often it happens inside a loop.
We might be clueless which python object or code statement is responsible for this increasing memory. What we can do in these situation is measure the memory consumed by each statement.
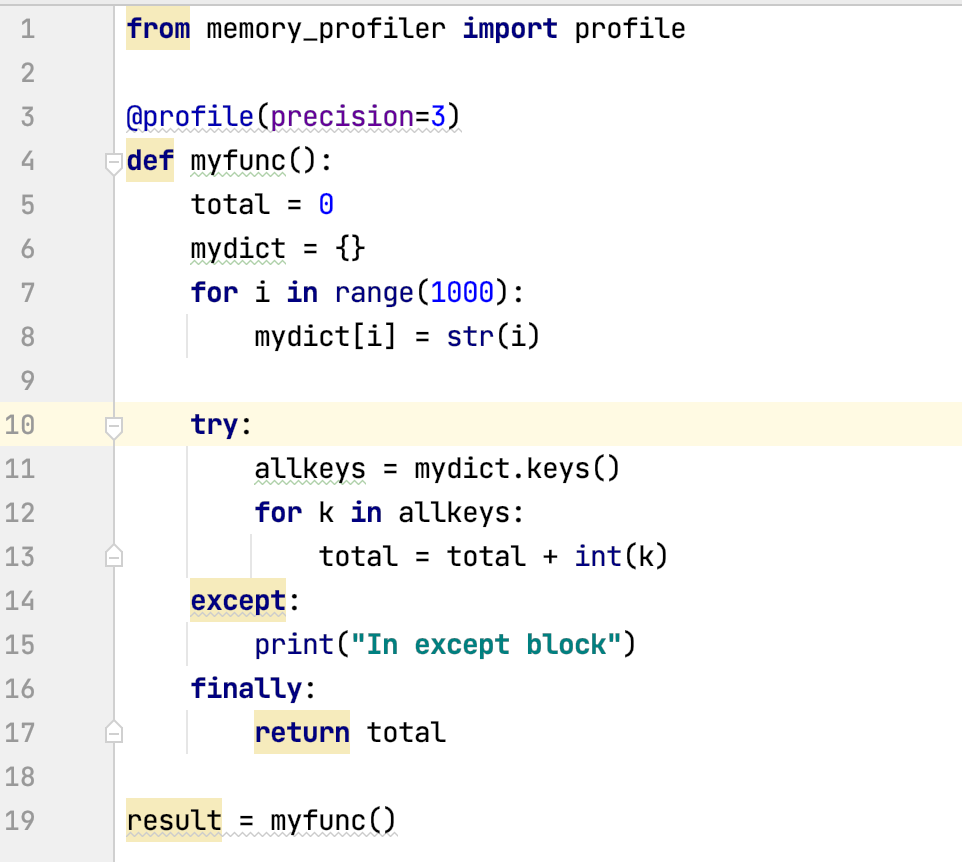
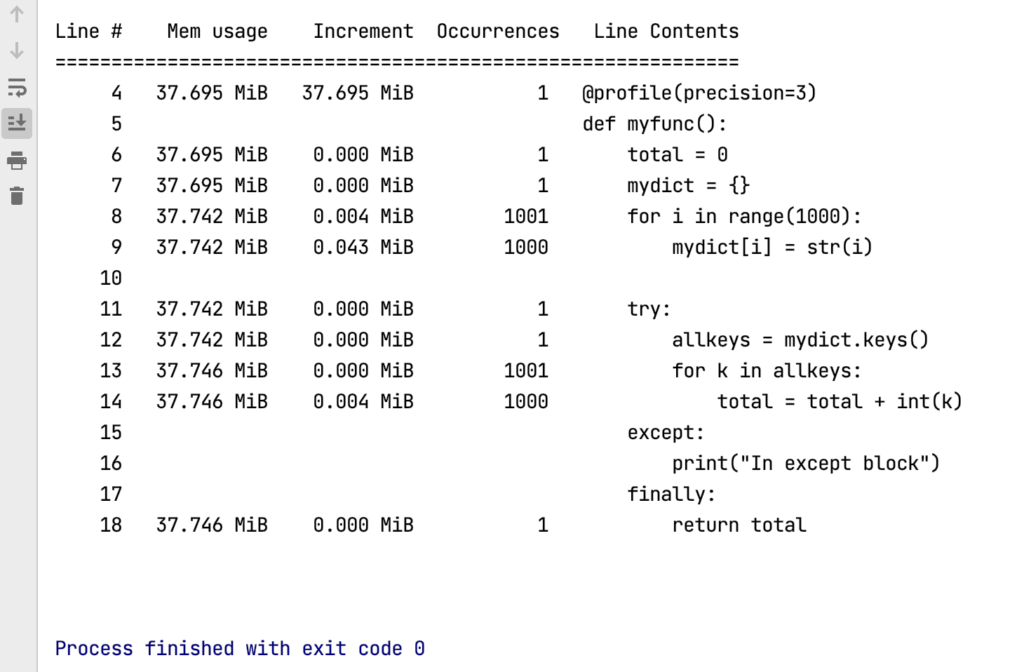
We have to ensure the code to be measured is structured into functions or classes. Import the library and add decorator @ profile before the respective functions that needs to be measured.
Simply execute the program for a limited number of iterations or make sure the program completes in a finite time. Once the program completes a report for every statement of functions with its increase in memory consumption will be printed in the console. (You can also simply redirect all console output to a text file when you execute the python program, that will be easy to read and interpret the result)
Try executing the sample program below to understand the use case.
The output of execution can be observed in the console window as below:
Efficient ways to reduce timing & memory consumption
Some of the efficient ways I could identify from multiple sources on internet to improve code performance are summarized below.
Use list comprehension instead of loops
Using map method instead of loop is also efficient.
Use multiple assignment in a single statement
Avoid global variables
Use inbuilt functions if it exists for your purpose
Concatenate strings using join
Generators are better to use in place of a function call, if you can wait for multiple results to appear one by one.
Write efficiently by evaluating conditions to break the loop first or return back and perform the actual part in outside of condition.
Avoid checking for default values multiple times inside a loop, instead use a try except to set default values.
Do not have import statements inside a loop.
Adopt a lazy load instead of loading everything in the beginning of the program, this will reduce the start time.
Learn & Use itertools if you are have data processing. If there is already a existing Inbuilt method in itertools that will be efficient.
Use data types from collections library if you have special use cases.
Function call overhead is higher compared to a for loop. Avoid creating simple one line functions if that can be achieved inside the loop itself.
Use a different interpreter of python like pypy version if possible. Which offers higher execution speed. (not all pip libraries will have compatibility. only a pure python can be executed in pypy environment)
Thank you for reading this far. Appreciate if you can share your experience or if you have any comments.
Like, Share & Follow this newsletter!
Thank you
Barani Kumar
(This article was originally published on my linkedin newsletter “Tech Square”)
https://www.linkedin.com/pulse/debugging-performance-measurement-improving-python-code-thiru/