What is linear regression
Linear regression is one of the most fundamental supervised machine learning algorithms. In this topic the objective is understanding and using linear regression in a finance use case.
Before proceeding let’s understand linearity and the algebraic equation to represent it.
A linear relationship between variables is referred as linearity in mathematics, meaning they are related by some proportion. Usually straight line relationships are inferred as linear, but they are not the only ones. Any equation if it confirms to following properties can be treated as linear. They are,
Property of Additivity, i.e f(x + y) = f(x) + f(y)
Property of Homogeneity of degree (multiplicative), i.e f(ax) = a^k . f(x)
Eg: log, exponential, etc are linear.
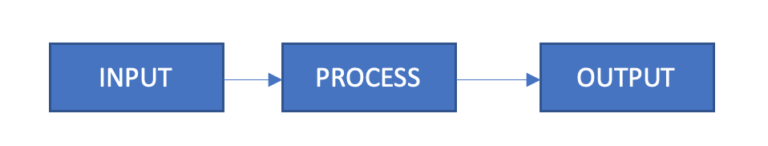
Any system can be represented in terms of Input, Process & Output. The same applies to machine learning problem as well.
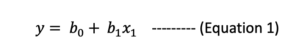
The Inputs here are on the right side of equation 1 (Here represented in terms of constants and x variables). These are also called the independent variables.
The output is the y variable on the left hand side. This equation represents a straight line. Referred as the regression line. These are also called the dependent variables.
One question to spend some time thinking especially if this is your first time exploring machine learning (regression) i.e if a system is represented by equation and a output can be derived then how different it is from a conventional mathematical system.
The answer is we do not have the equation in first place, we only have data measurements of every variable. Only we derive the mathematical model, a probable explainable model. This mathematical model is called as the machine learning model.
A Finance use case
Let’s understand with a problem and a solution, (how a mathematical regression model is derived).
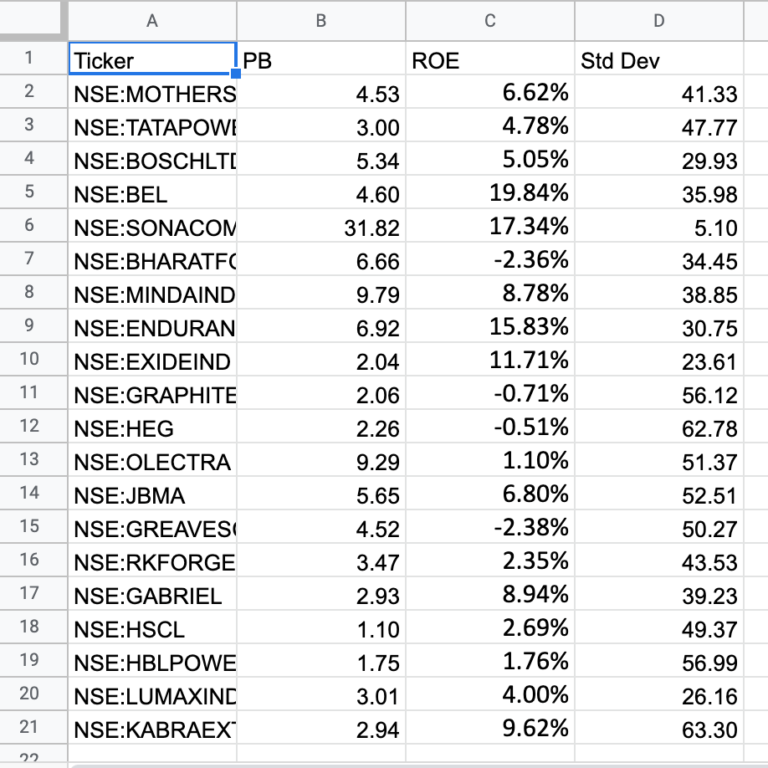
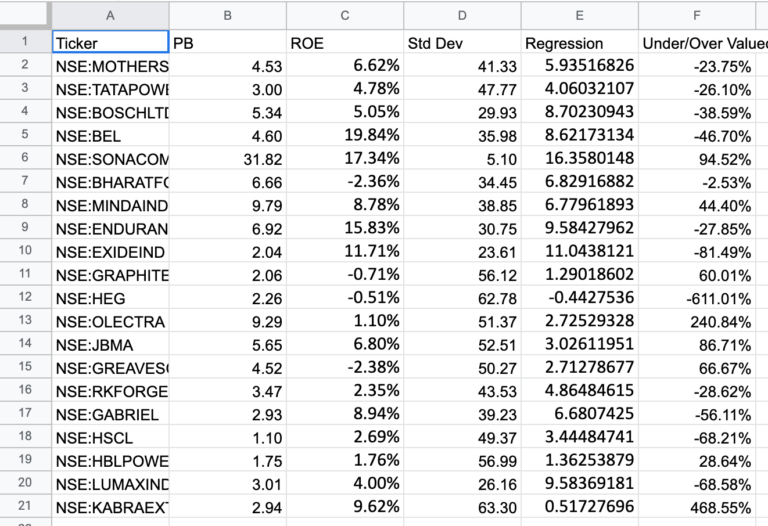
There are 4 columns in the data considered below, we are interested in calculating the predicted PB values.
Column ‘Ticker’ is a name identifier, This is a meta data and we will ignore this column as of now.
Column ‘PB’ (Price to Book Value) is the output column.
Column ‘ROE’ (Return on Equity) is a input
Column ‘Std Dev’ (Standard Deviation of Prices) is a input
There are 2 input columns and 1 output column. The goal is to calculate predicted PB value. The reason for choosing PB to predict as output is subject to the domain (Here it is equity data). PB is calculated by the market based on traded stock prices. The scope of explanation for change in PB is very limited and becomes speculative quickly. Also, there is no defined relationship in finance to link this output to the considered inputs. Hence using related factors of the stock ROE and Standard Deviation an attempt to derive a predicted PB is made here. Based on predicted value we can make some inferences later.
Now we have the equation,
But we do not have the coefficients with us now, the objective of machine learning problem is to identify the best coefficients using the available data of x inputs.
The dataset is converted to a system of matrix and the coefficients for the quadratic equation can be identified through optimization solutions. It could be either quadratic minimization approach (coefficients are obtained by minimizing the sum of residuals of the equation) or maximum likelihood estimator . The coefficients are identified using the mathematical principle “ordinary least squares” method.
The calculate coefficients are,
15.992249974634388 intercept
9.957592100525998 ROE
-0.26020114102494024 Std Dev
The above coefficients help to reconstruct and complete the equation 2. This will be the regression model. With the model, PB values are predicted and they are displayed in the below table.
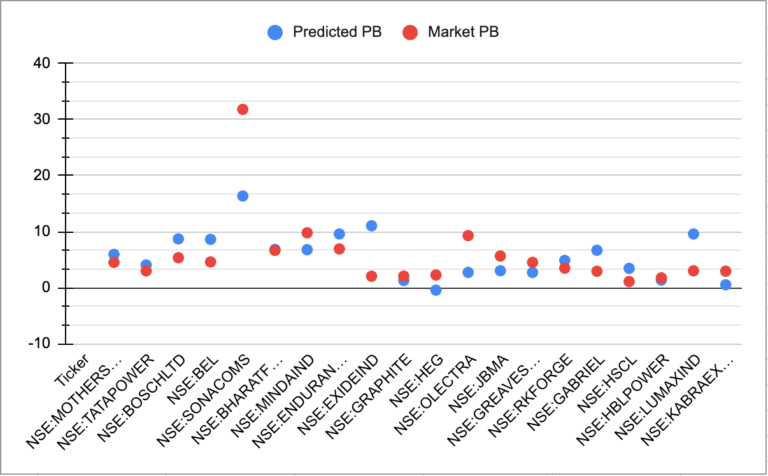
This chart plots ticker on x axis, and on the y axis both market PB (Red) and predicted PB (Blue) are plotted.
Inference and conclusion
The absolute difference between the calculated values are taken here to represent either the stock is overvalued or undervalued. In finance a stock is termed under valued when the market price is lesser than the fair value. Whereas over valued when the stock is priced more than the fair value. Indirectly Price to Book value represents here the stock price. It is the relation between Market price of stock to the Book value of the stock.
PB = Market price / Book Value per share
Also stocks can be compared with each other to see which are overvalued and undervalued as well. This will be a relative comparison. One primary reason to use this is fair value is, it subjective. The calculation of the true value of a stock price is exhaustive procedure as well.
Here in this exercise we have followed a new approach, the. market price to book value are compared against the predicted price to book value to identify overvalued and undervalued scenarios. The predicted values are obtained through the regression model, the reasoning for this approach is that we are trying to represent through a machine learning model the universe of stocks under consideration. The calculated output is treated as the future value.
The approach of using linear regression for this financial data is taken from the book “Investment Valuaitons” by Prof. Aswath Damodaran.
For writing this article, i have taken the actual market data of 20 Electric vehicle related stocks and calculated and undervalued vs overvalued percentages.
This is purely for educational purpose and not to be treated as a investment advice.
To learn personal finance and investing you can checkout the following books, Money Leaks, 1 Page Stock Market Pln, 1 Page Mutual Fund Plan (All print formats in below link)

To purchase in eBook format available on Amazon Kindle.
To improve your financial prudence and achieve financial freedom check here for financial advisory and AMFI certified mutual fund distributor Ganesan Thiru, he is author of 3 books Money Leaks, 1 Page Mutual Fund Plan & 1 Page Stock Market Plan.